 As a backend developer, I don't get to work with JavaScript much anymore. However, from time to time, a project would come along that uses JavaScript (specifically, AJAX) to load some backend data on the fly. Of course, nothing works 100% right away*, so I would often have to tweak this JavaScript and massage it until it does what I need.
Here's where Firebug comes in with its JavaScript debugger. I'm used to using a debugger in every language I deal with, so using Firebug is a no brainer. Since it supports breakpoints, stopping execution and inspecting local variables and the rest of the scope generally beats alerts and console.logs for me.
Here's what a typical breakpoint looks like in Firebug:

It's easy to set breakpoints in static scripts – just open the Scripts tab, select a JavaScript file from the dropdown menu, and click to the left of the wanted line number.
Then, when the page is reloaded, if your breakpoints are triggered, Firebug will pause script execution and transfer the control to you.

In most cases, the method above is the only method of setting breakpoints you will ever need to use.
The Problem With Dynamic JavaScript
However, what if the JavaScript file where you need to set breakpoints is not static but instead dynamic (generated on the fly). If you set a breakpoint in this case and reload the page, the breakpoint will most likely disappear, especially if the JavaScript url is generated uniquely every time.
The Solution
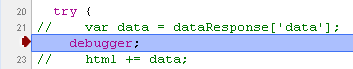
If you have access to the source, the solution comes in the form of the
debugger; |
keyword. Just add it to your dynamic JavaScript generator or into any JavaScript file you have access to exactly where you want Firebug to break, and voila – it does.

More so, this method also works in Google Chrome and IE (if you have Microsoft Script Debugger). Here is a screenshot of my Chrome Beta 4.0.266.0 triggering:
I consider this feature relatively unpublished and therefore awesome because:
- it's hard to search for this specific meaning of the keyword "debugger" when Firebug itself is a debugger and it's a very popular word
- nobody really reads documentation for Firebug, and even if they do, I haven't actually seen the debugger keyword mentioned
- I didn't know about it until recently, even though I've been using Firebug for years
Of course, you need access to the code for this to work, so it's not going to work if you're trying to debug someone else's JavaScript.
And finally, don't forget to remove any traces of 'debugger' from your code when you go live or your users will rightfully hunt you down.
Credits And References:
- suggested by a co-worker from Plaxo – Russ. Thanks Russ!
- some more interesting info at StackOverflow and Infragistics.
Happy debugging!
(*) – if your project works 100% on the first pass, you must be either a magician or Jon Skeet (Jon Skeet Facts – a-la Chuck Norris, a must read).
In the meantime, if you found this article useful, feel free to buy me a cup of coffee below.

